
TomTom have published the latest edition of their much-anticipated Traffic Index.
For more than 15 years, the TomTom Traffic Index has monitored the health of our roads, capturing its minute-by-minute pulse to assemble a year-long overview of how vehicles have moved through hundreds of our world’s major cities. This year’s edition tells a painfully familiar story. As cities grow and journeys multiply, the challenge of managing city road networks continues to loom over municipalities, town planners and transit authorities. The Traffic Index confirms that keeping traffic moving has never been more difficult. How can we keep tackling such a challenge? With data, lots of data.
The numbers are in, and all over the world in 2025 the overarching trend is that congestion, by congestion level and travel time per kilometer, has worsened.
Major cities experienced increased travel times, including, London, England; Bengaluru, India; Dublin, Ireland; Mexico City, Mexico; Barcelona, Spain; Athens, Greece; Milan, Italy; Rosario, Argentina; Hiroshima, Japan; San Francisco, United States; and many others.
The 2026 edition of the TomTom Traffic Index has revealed some fascinating facts and figures in relation to the “performance” of the UK and some of its major conurbations, including:
• London ranks as the world’s slowest capital city for travel time for the third year running
• The average London driver lost 136 hours – equivalent to more than five days – stuck in rush hour traffic in 2025
• With September 10th dubbed ‘Jam Wednesday’ as Tube strikes saw congestion levels up 91% on an average day in the capital
• Belfast is the UK’s most congested city, with theNorthern Irish and Scottish capitals also ranked as some of the world’s top 40 most congested global cities
London is again the slowest city in Europe. It saw its average per km travel time rise 4 seconds from 3 minutes 34 seconds in 2024 to 3 minutes 38 in 2025. Its congestion level rose from 50.6 to 51.6. With free-flow travel times increasing by 1 second from 2 minutes 22 to 2 minutes 23 per km. This could suggest that changes to infrastructure do not improve outright travel times for cars, as free-flow state did not improve. The rise in Congestion Level further suggests that England’s capital is not improving the flow of vehicles through its inner-city corridors.
Mexico City ranks as the most congested city in this year’s Traffic Index, with a score of 75.9. Its free-flow travel time is just 1 minute 57 seconds per km, but its average real-world travel time is 3 minutes 27 per km. By travel time, it ranks seventh in the world. Bengaluru, India, ranks second (74.4) with .Dublin third (72.9). Dublin also ranks as sixth slowest city in the world with a travel time of 3 minutes 27 seconds per km.
Interestingly, the Congestion Level improved in 125 cities, suggesting that traffic flowed slightly better in these cities in 2025 than it did in 2024. But, as the Index suggests, traffic isn’t just about speed, it’s also about flow. Considering the data with flow in mind, we see a potentially more positive story for some cities.
Groningen, Kiel, New Orleans, Paris, Rome, Mumbai and Riyadh all experienced a decrease in their congestion levels ranging from 23% to 5% respectively.
However, this data shouldn’t be viewed in isolation, insists TomTom. Many cities have recently lowered speed limits, added cycle lanes and upgraded infrastructure to support more ways of moving through their transit network. These changes can increase free-flow travel times for vehicles by shifting focus away from road traffic. If actual travel times stay the same while free-flow times rise, congestion levels will appear to decrease — not because roads are moving faster, but because infrastructure changes have reduced the difference between freeflow and actual travel times.
The full TomTom Traffic Index can be accessed HERE.
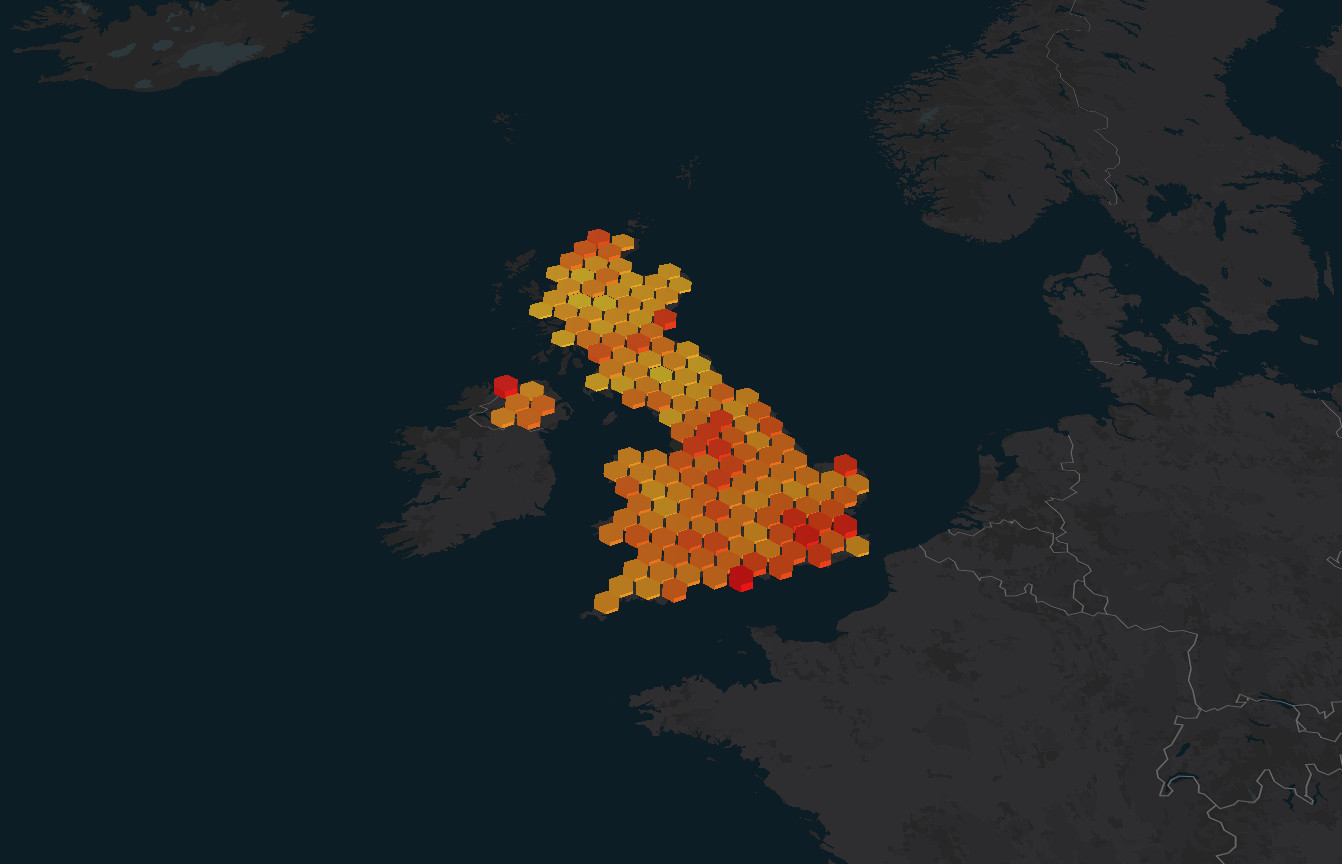
(Picture: TomTom)