As Covid-19 restrictions were eased across the UK, transport analytics and connected car services company INRIX has published the 2021 INRIX Global Traffic Scorecard, revealing the full impact of pandemic recovery on UK roads.
INRIX says that earlier this year, as cases fell across Europe and the UK, the “new normal” started to take shape. Remote work policies gradually eased, and people were encouraged to venture outside. The success of vaccine rollouts gave new hope to those wanting to resume life as it had been before the pandemic. Unsurprisingly, these changes spurred increases in domestic travel while and international travel still proved difficult in the early part of the year.
To quantify the impact of eased restrictions, the 2021 INRIX Global Traffic Scorecard identifies and ranks congestion and mobility trends across more than 1000 cities, across 50 countries – including the UK.
On average, British drivers lost 73 hours this year in traffic, up from 37 hours last year but down from 115 in 2019 pre-COVID. Nationally, Brits spent nearly 1 billion hours (980 million) sitting in traffic costing £595 per driver and the country £8 billion.
Drivers in London, Cambridge, and Bristol lost the most time to traffic congestion (148, 75 and 66 hours respectively), despite seeing large reductions compared with 2019 (down 53%, 42% and 64% respectively). Exeter saw the largest increase in congestion with delays increasing by 27% from 2019.
The top ten congested British cities in order are London, Cambridge, Bristol, Exeter, Cheltenham, Manchester, Belfast, Birmingham, Nottingham and Hull.
Pre-pandemic, much of the UK’s traffic congestion centred around commutes to, from and within city centres. As the closure of offices, restaurants, entertainment, fitness centres and other brick-and-mortar storefronts, along with limits on gatherings were imposed, trips fell leading to large reduction in 2020. INRIX says the trend has reversed as restrictions have been eased but has not returned to pre-COVID levels and most cities still saw lower numbers than 2019 levels.
Cities in the UK reacted strongly to lockdown measures. During the first UK lockdown, travel to city centres dropped 75% in April 2020. The lifting of that lockdown on June 1st 2020 led to strong rebounds in city centre activity. However, trips to city centres had dropped again in November 2020, as the UK’s second lockdown came into force. By February 2021, the UK entered its third lockdown – coinciding with new COVID-19 variants being discovered. This resulted in a 52% retraction in trips to city centres among major cities analysed.
As lockdowns and other restrictions were lifted, people returned to city centres but not at the same levels as 2019. London experienced a 13% drop in travel to the city, as remote and hybrid work continued. Bristol saw the largest drop in drivers to the city centre with trips down 28%. In fact, only Cambridge saw traffic levels remain the same or higher in the UK’s top 10.
Throughout the country, delays on the busiest corridors decreased versus 2019. In 2020, the five busiest corridors were all in London – the A503 E/B, the A2 W/B, and A406 North Circular Road E/B (with 42, 39 and 38 hours respectively). Outside of London, the busiest corridors were Belfast’s A644 East, Birmingham’s A435 South and Liverpool’s Queens Drive (with 15, 14 and 14 hours respectively).
At the global level, London topped the list of cities most impacted by traffic congestion with drivers losing 148 hours a year to congestion (-1% from 2019) followed by Paris, Brussels, Moscow and New York City. In Europe, St Petersburg saw the greatest reductions in delays compared to 2019, dropping 50%. Nimes in France, however, saw congestion nearly double (98% increase) compared to 2019.
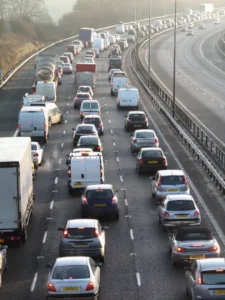
(Picture – Yay Images)


